Sometimes we need graphic representations of the binary systems in order to understand better the behaviour of the components. For this situations we can make two types of graphics: P(xy) and T(x,y).
P(x,y): keeping a constant temperature vs concentration of the components (xy).
T(xy): keeping a constant pressure vs concentration of the component (xy)
P(x,y): keeping a constant temperature vs concentration of the components (xy).
T(xy): keeping a constant pressure vs concentration of the component (xy)
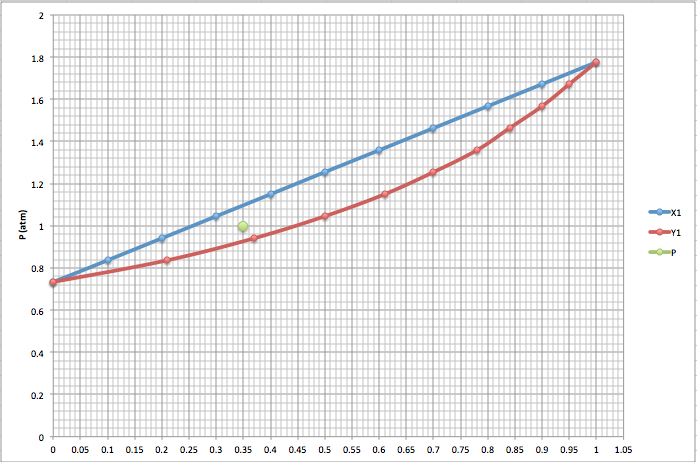
Example of P(xy) diagram (mixture of benzene and toluene)
|
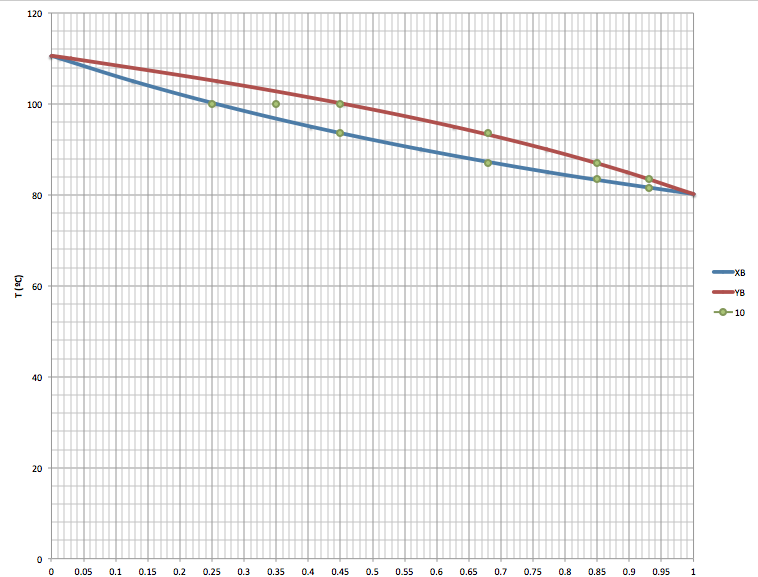
Example of T(xy) diagram (mixture of benzene and toluene)
|
This graphics also help us to know the theorical plates that are the number of effective vaporisation and condensation steps that are required to achive a condensate phase of a given composition for a given distillate.
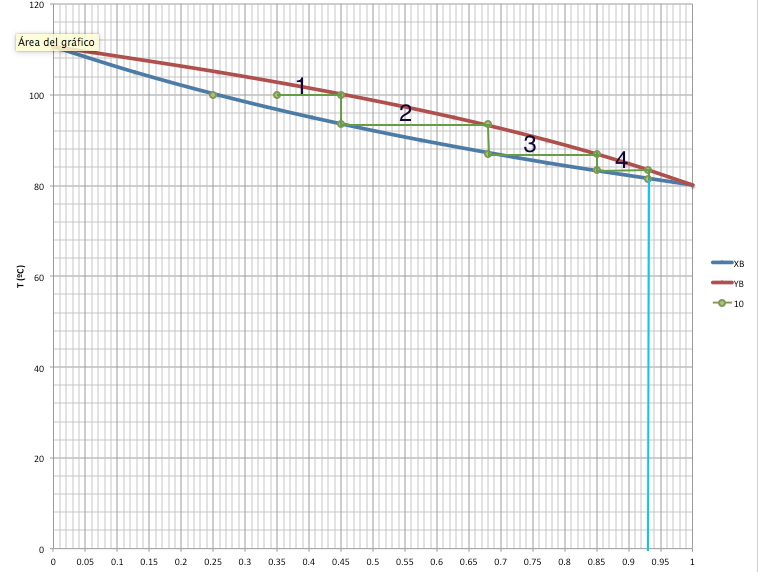
Number of theorical plates represented in a T(xy) diagram
When a mixture of two or more liquids give a vapor that is in equilibrium with its liquid and have the same composition of the liquid, the mixture is called an azeotrope.
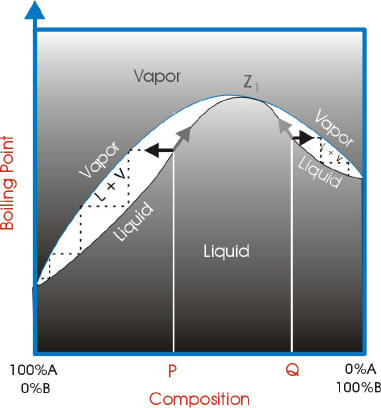
Fractional Distillation and Vapor Liquid Equilibrium. From B/R Instrument Corp Web: http://www.solvent--recycling.com/fractional%20distillation.html
Simulations.
|
|
|
References:
- Dupont Durst, H. Gokel, George W.. (2007). Química orgánica experimental. España: Reverté.
- LearnChemE (2015). P-x-y and T-x-y Diagram for VLE (Interactive Simulation). Retrieved from: http://youtu.be/19gr-1ePMAI
- LearnChemE (P-x-y Diagram for VLE (Interactive Simulation). Retrieved from: http://youtu.be/6l3NTuYkeC8
